


Environment
Chemicals management
Green Procurement
We have established the Basic Environmental Policy and CSR Procurement Guidelines to contribute to global environmental conservation, the realization of a recycling-oriented society, and the creation of safe working environments. As part of these efforts, we actively promote Green Procurement, giving priority to environmentally conscious suppliers and the procurement of parts, materials, and products with low environmental impact.
To implement this initiative, we have formulated the “Komori Group Green Procurement Guidelines” and are working with our suppliers to manage chemical substances in compliance with domestic and international regulations.
Compliance with the PRTR system
We manage, notify, and disclose information on emissions and transportation of substances that are considered to be potentially harmful to human health and ecosystems.
Compliance with the Fluorocarbons Emission Control Act
We conduct annual inspections and basic inspections of products and maintain a history of said inspections to ensure thorough compliance.
Environmental Data
Greenhouse Gas (GHG) Emissions
(Unit:t-CO2)
Unit:t-CO2
| Item | FY2022 | FY2023 | FY2024 | FY2025 | |
|---|---|---|---|---|---|
| Scope1 | 5,003 | 4,883 | *14,570 | 4,555 | |
| Scope2(location-based) | 13,221 | 13,073 | *112,049 | 11,872 | |
| Scope2(market-based) | 12,553 | 13,485 | *111,709 | 11,381 | |
| Scopes 1 and 2 in total(Scope 2 is market-based) | 17,556 | 18,368 | *116,279 | 15,936 | |
| Scope3 | 1,064,832 | 1,182,737 | 1,090,125 | 1,056,651 | |
| Category | |||||
| 1 | Purchased goods and services | 374,070 | 459,015 | 458,067 | 441,359 |
| 2 | Capital goods | 4,416 | 5,461 | 6,543 | 10,166 |
| 3 | Fuel and energy related activities | 1,559 | 1,416 | 1,555 | 1,552 |
| 4 | Transportation and distribution (upstream) | 24,599 | 26,394 | 29,312 | 28,446 |
| 5 | Waste generated in operations | 116 | 122 | 149 | 157 |
| 6 | Business travel | 979 | 696 | 1,290 | 4,201 |
| 7 | Employees commuting | 3,274 | 3,404 | 3,075 | 2,630 |
| 8 | Leased assets (upstream) | - | - | - | - |
| 9 | Transportation and distribution (downstream) | - | - | - | - |
| 10 | Processing of sold products | - | - | - | - |
| 11 | Use of sold products | 653,427 | 683,565 | 587,741 | 565,668 |
| 12 | End-of-life treatment of sold products | 2,392 | 2,664 | 2,393 | 2,472 |
| 13 | Leased assets (downstream) | - | - | - | - |
| 14 | Franchise | - | - | - | - |
| 15 | Investments | - | - | - | - |
The above table can be viewed in its entirety by scrolling horizontally.
*1 Past actual values have been corrected as errors were found in the usage data and emission coefficients for some operational locations.*Access the linked URL below for details of the calculations.
Environmental data and third-party assurance
To verify the validity and objectivity of the non-financial information Komori discloses, we received third-party assurance by Asuene
Veritas Inc. for some of the data on the “Environmental Data” page in the “Environment” section on our website. The data that received
the third-party assurance are indicated with check marks( ). Please access the linked URL below for details.
https://www.komori.com/ja/jp/sustainability/environment/esg3.html#e08

INPUT/OUTPUT for the year ending 31 March 2025
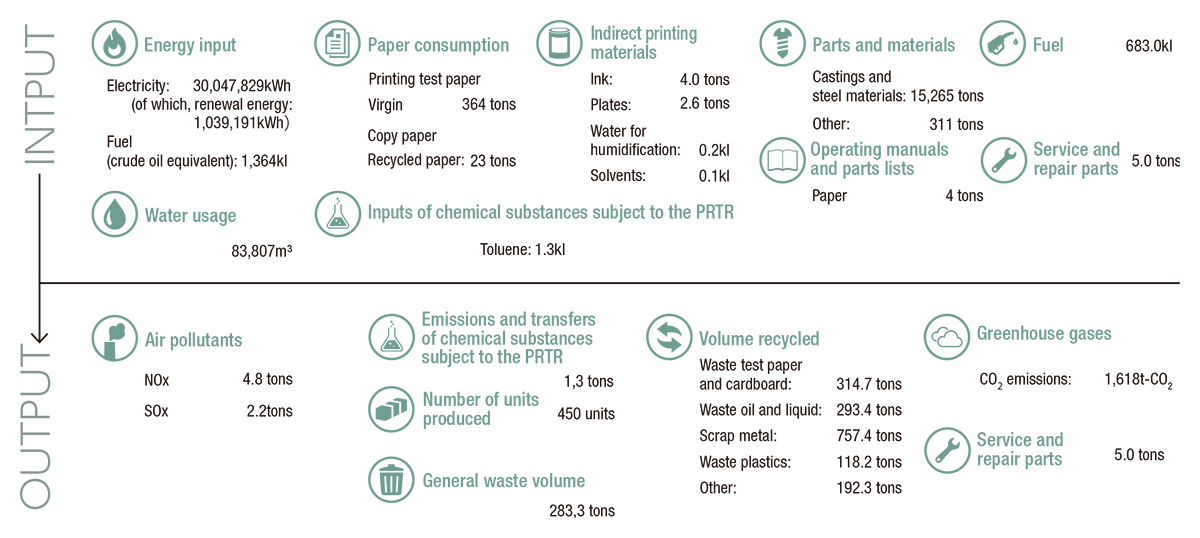
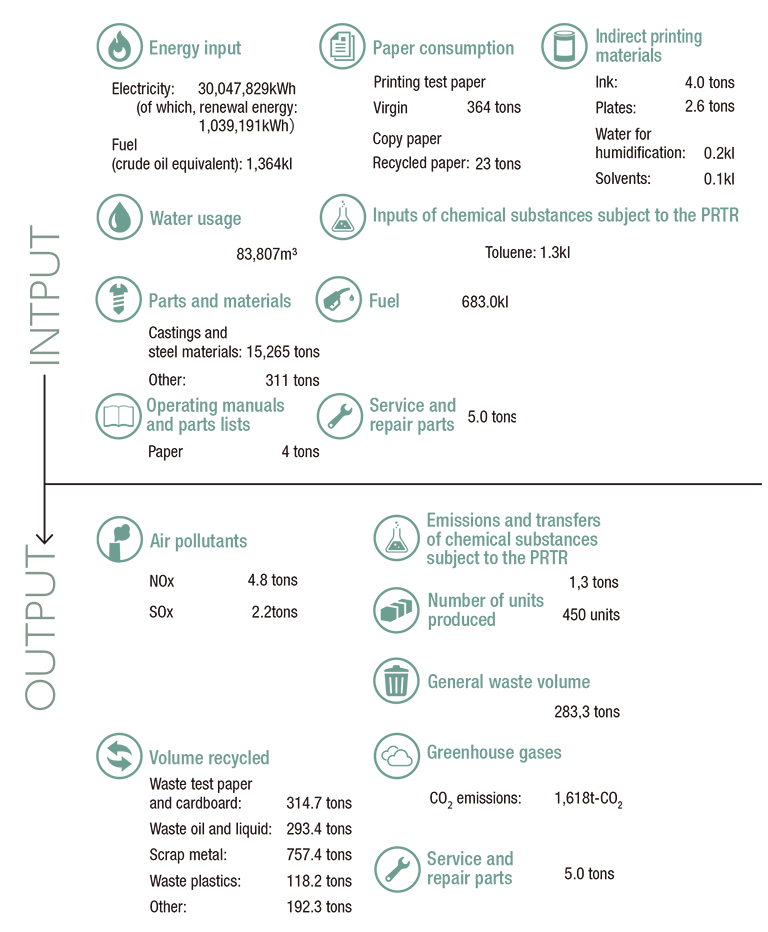
Key Environmental Data
| Item | Unit | FY2021 | FY2022 | FY2023 | FY2024 |
|---|---|---|---|---|---|
| Emissions for Scope1 | t | 4,835 | 5,003 | 4,883 | 4,548 |
| Emissions for Scope2(location-based) | t | 12,070 | 13,221 | 13,073 | 12,619 |
| Emissions for Scope2(market-based) | t | 11,923 | 12,553 | 13,485 | 11,708 |
| Emissions for Scope 3 | t | 560,007 | 1,064,832 | 1,182,737 | 1,090,125 |
| Energy usage | MWh | 28,391 | 31,331 | 31,073 | 29,008 |
| Renewable energy electricity output (amount used) | MWh | 597 | 597 | 625 | 1,039 |
| General waste volume | t | 252 | 361 | 353 | 283 |
| Water usage | m3 | 112,290 | 122,981 | 92,379 | 83,807 |
The above table can be viewed in its entirety by scrolling horizontally.